Grid Map: Bridging the Gap Between Proportional Symbol Map and Choropleth Map in Providing Geospatial Intelligence
April 21, 2026
Proportional Symbol Map can show the quantity for specific geographical points by symbol size. If there are thousands of points on a map, it will be very difficult for you to get any insights from the map. The below is an exmaple.
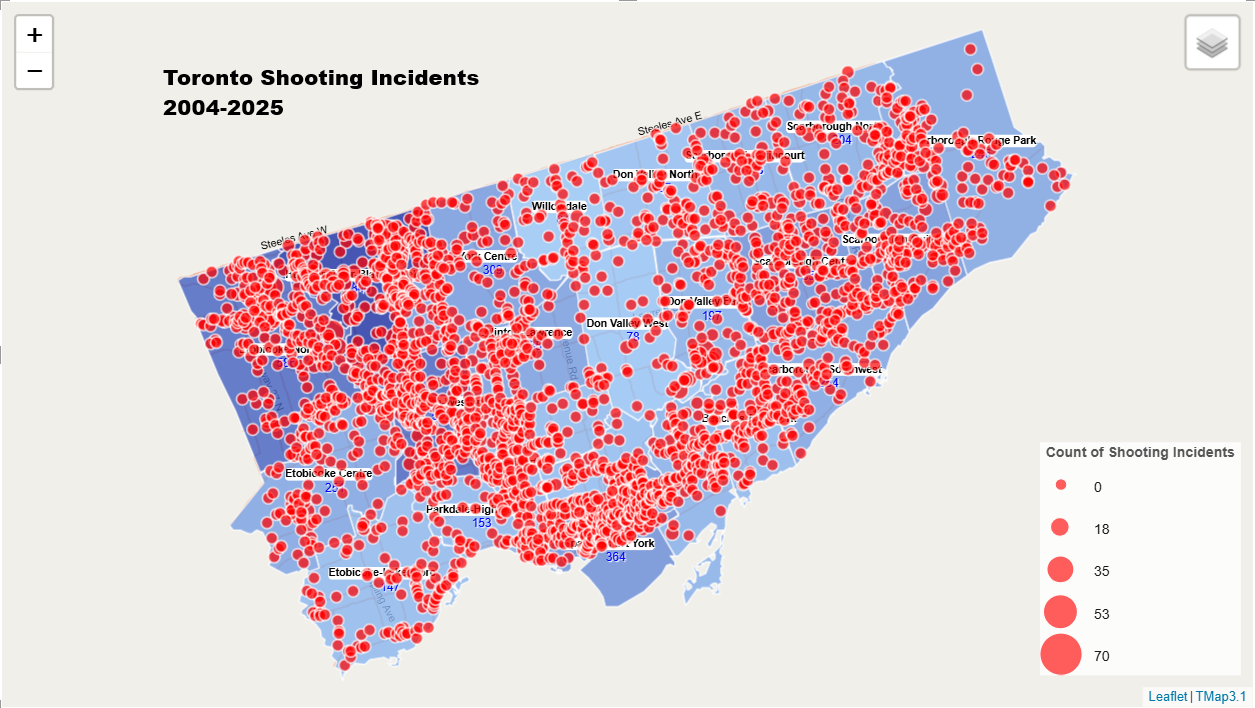
If you use TMap Outlier Analysis, you can get insightful map below. From the map, you can see the locations with the most shooting incidents occured in Toronto during 2004-2025 easily.
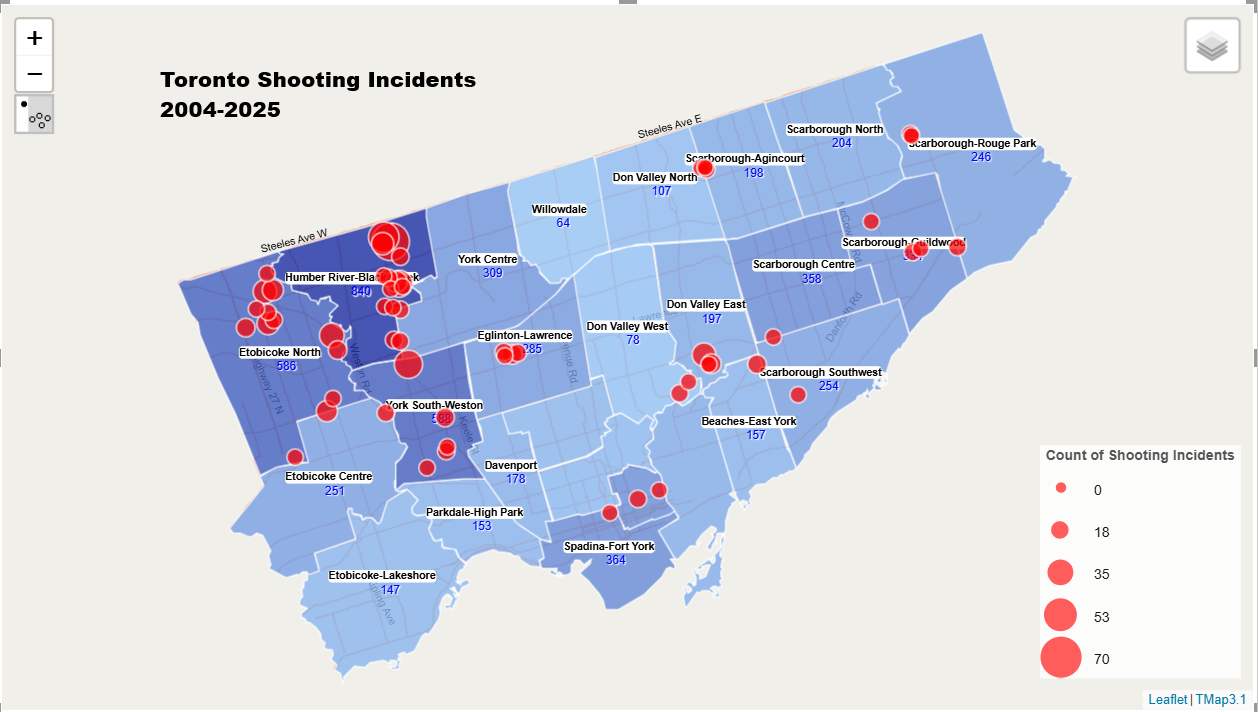
You still couldn't find the overall situation from the maps above because some locations with low counts were filtered out. You can use Choropleth Map to aggregate them by geographical regions. The following is a map aggregated toronto shooting incidents from 2004 to 2025 by city wards. From the map, we know which ward has the most incidents, and which ward has less incidents.
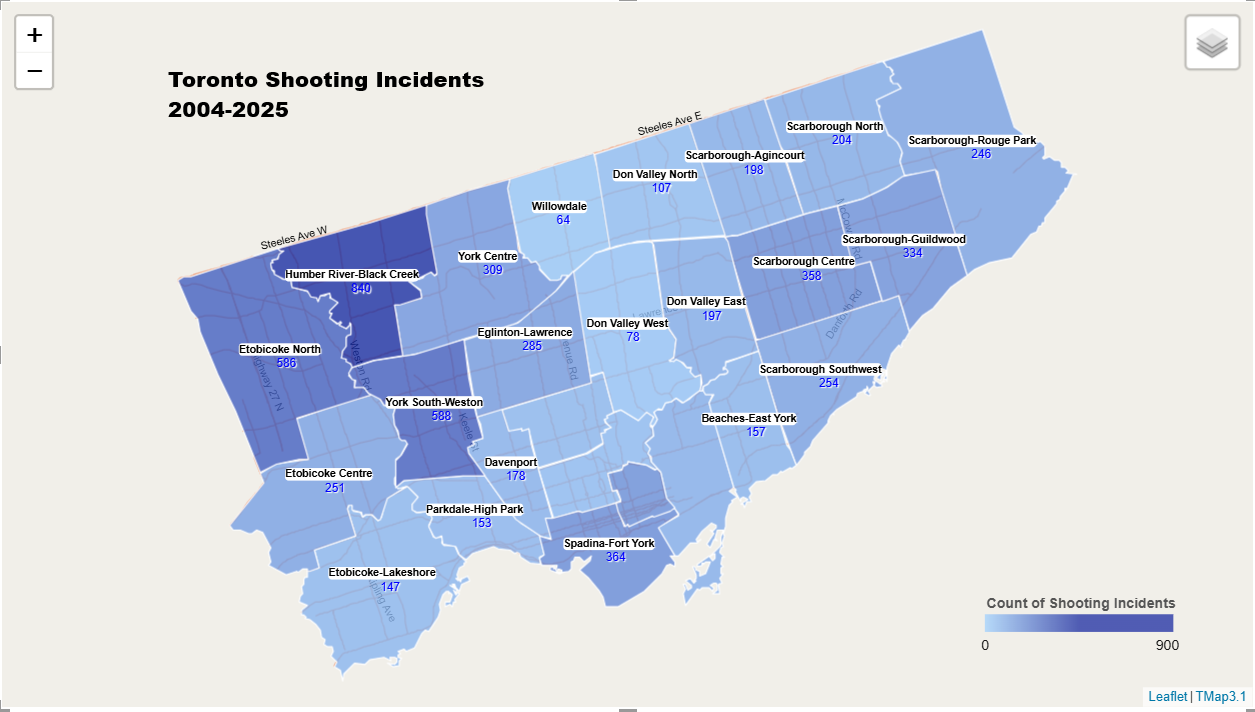
Proportional Symbol Map provide insights for specific points, Choropleth Map provide insights for regions. Is there a map providing insights between them? Yes, Grid Map can provide insights for a grid larger than a point and smaller than a region. Following is a grid map showing toronto shooting incidents during 2004-2025. From the map, we can find spatial pattern and hot spots for shooting incidents in Toronto easily, that is, Jane-Finch area, Lawrence Heights, Downtown area extending east to Regent Park and west to Bathurst St.
Please go to tutorials to find how to create grid map in TMap.
You can go to Microsoft AppSource to download TMap Visual and try it.